Cassava Leaf Disease Classification
Cassava Leaf Disease Classification Competition
This repository contains the code of my attempt to compete in this competition.
Context
As the second-largest provider of carbohydrates in Africa, cassava is a key food security crop grown by smallholder farmers because it can withstand harsh conditions. At least 80% of household farms in Sub-Saharan Africa grow this starchy root, but viral diseases are major sources of poor yields. With the help of data science, it may be possible to identify common diseases so they can be treated.
Existing methods of disease detection require farmers to solicit the help of government-funded agricultural experts to visually inspect and diagnose the plants. This suffers from being labor-intensive, low-supply and costly. As an added challenge, effective solutions for farmers must perform well under significant constraints, since African farmers may only have access to mobile-quality cameras with low-bandwidth.
In this competition, a dataset of 21,367 labeled images collected during a regular survey in Uganda has been provided. Most images were crowdsourced from farmers taking photos of their gardens, and annotated by experts at the National Crops Resources Research Institute (NaCRRI) in collaboration with the AI lab at Makerere University, Kampala. This is in a format that most realistically represents what farmers would need to diagnose in real life.
Compeition Task
This is a Image Classification task where participants are to classify each cassava image into four disease categories or a fifth category indicating a healthy leaf. High scoring models will help farmers to quickly identify diseased plants, potentially saving their crops before they inflict irreparable damage.
Data
tfrecords
The format of provided data is in tfrecords. They were 21,367 images provided with 16 tfrecords files. In order to process this huge amount of data, TPU accelerators were used to bring in the data using data generator utilites avialble in TensorFlow.
Data Generators
Given the large data size, it does not make sense to use static data loaders. All the training data was fed to the models using data generators for increased efficieny.
Locatin Training Files
In order to use a TPU, data has to be fed through a path in Google Cloud storage. This means that we are using the path to where the images have been saved on cloud:
- We get the path to the GCS of the given data.
-
Then we retrieve the file paths based on a pattern using regular expressions.
GCS_PATH = KaggleDatasets().get_gcs_path('cassava-leaf-disease-classification')
TRAINING_FILENAMES = tf.io.gfile.glob(GCS_PATH + '/train_tfrecords/ld_train*.tfrec')
Generating the data
After having the file names in a Cloud Storage, data is generatively passed accessed tf.data.TFRecordDataset utility:
- Images will be shuffled when passed to the model
- Images will be randomly augmentated to avoid overfitting
python
    def get_training_dataset(file_names, augmenatate=False):
        dataset = load_dataset(file_names, labeled=True)
        if augmenatate:
            dataset = dataset.map(data_augment, num_parallel_calls=AUTOTUNE)
            dataset = dataset.repeat()
        dataset = dataset.shuffle(shuffle_seed)
        dataset = dataset.batch(BATCH_SIZE)
        dataset = dataset.prefetch(AUTOTUNE)
        return dataset
Utilities used for Data Generation (slightly modified) from Keras Guide
Imbalanced Data
They are 5 categories of data available within the labelling. It is natural that some cases are more frequent than others, one could postualte that it has something to do with the commonness of a specific disease relative to others. By looking at the break down of each disease, we observe that the data is imbalanced.
- Mosaic Disease (CMD): It has the largest occurance among all the classes with ~60 percent majority.
- CBSD, CGM, and Healthy leaves have the same percentage within the data with 12-15 percent
- CBB has only 5 percent of share in the dataset, meaning 1/12 of CMD and half of other classes
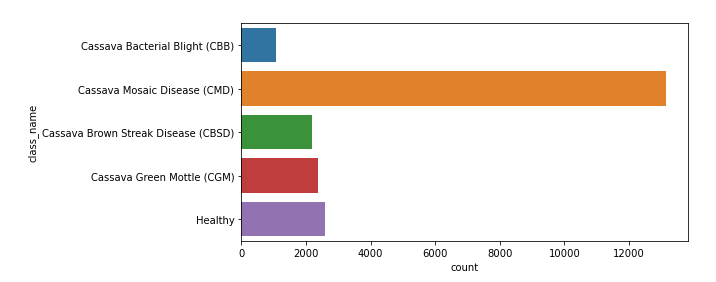
Given the imbalanced share of classes within the provided data, overfitting is inevitable. Thus, augmentation data and increasing the quantity of some classes is a priority. ## Data Augmentation Data is being augmentated while being fed to the model. However, it would be helpfull to generate data seperately to increase the number of some classes. Data has been augmentated using the [albumentations](https://albumentations.ai/), the number of CBB (5%) were eight folded during this process. Some image transformers were intilialized to generate new images with deviations from the original image. Set of utilites were used to augmentate specific classes: - Given the break down dictionary, data was augmentated. - Using this stratedgy each **_.tfrec_** file had an equal number of classes Then the actualt augmentation happens by randomly assing the transformers to the images: - Underrepresented classes will have more transformers assigned to them. - Default dictionary for augmentation: - 25 label 0's are chosen and eight folded - 50 label 1's chosen and four folded - 200 label 2,3,4's are chosen and transformed only once. [4] Augmentated data has been saved to [Kaggle Dataset](https://www.kaggle.com/damoonshahhosseini/cassavaaug) for further use in the future.