The Role of Image Augmentation on Brain MRI Segmentation Accuracy
Guide to the project
- The modelling is done on a kaggle notebook, different versions of the notebook can be seen on the website where different training sets were used to train the model.
- utils.py: functions used for loading and generating augmented images
- Jupyter notebooks contain the EDA and augmentation processes.
Abstract
Deep convolutional neural networks are effective in a wide range of computer vision applications however they rely on large amounts of data for accurate results. In certain fields there is not enough data available to utilize these models to their full capacity. For instance in medical imaging, it is difficult to gather a large collection of MRI images due to privacy concerns. Image augmentation can address the lack of big data by generating extra images using the available images. The generated images will share the details of original images but with subtle differences. Generating images increases the overall size of the data, balances the class labels, and results in a more robust model since the model is exposed to different pictures. Overall data augmentation can make the model less biased and prevent overfitting. In this project, I have identified that there exists various biases that reduce model accuracy. For instance, if the number of images with large segmentation areas is more than images with small areas then the model will be more accurate for those images. This is problematic for cancer detection since one of the main goals of MRI images is to detect cancerous tumors early (when they are small). Different training sets are generated and used to train the same model to investigate the role of class imbalance and different image transformations.
Introduction
Deep convolutional neural networks are the model of choice for learning patterns within images. These models can learn to detect, classify [3] and segment objects within images. Using these models we can automate vision-related tasks. For instance self-driving cars rely heavily on a combination of classification and segmentation to operate. With the rise of cheap computing power, these models are more accessible in different fields.
Medical imaging is one of the areas where vision models can be helpful. Deep Learning models can help doctors detect and segment cancer faster. Traditionally doctors would look at MRI images then estimate whether the cancer is present, and where it is located. The main focus of this paper is on Glioma cancer which develops mainly in the brain and spinal cord. It is difficult to remove this cancer using surgery, hence being able to prevent or detect this type of cancer early is very valuable. Recent studies show that lower-grade Glioma can progress to become dangerous. By detecting the patterns and classifying different types of lower-grade Glioma, various genetic properties of this cancer are being studied [7]. Deep models can make detection and segmentation processes a lot faster, cheaper, more accessible, and potentially more accurate.
By gathering a collection of segmented MRI images by doctors, deep learning models can learn the patterns, and segment new MRI images. However, data collection is very difficult in radio images since some patients may choose to not share their MRI images publicly. Image augmentation can be a solution to the lack of big data in this field. Sufficient amounts of data can be generated by using various transformations and sampling methods. While augmenting images, the goal is to preserve the general features of an image but alter certain characteristics so that different neurons within the network are activated but the same results are achieved.
Data
MRI images used for this paper are originally used in [4] and [7]. This dataset is hosted as a Kaggle dataset [2], and it is imported from Kaggle for model training. Data has a class imbalance where there are 2556 negative and 1373 positive cases. Positive meaning that cancerous patterns are present in MRI images. One of the problems that augmentation can address is the class imbalance, and some of the experiments are designed to compare the case where class imbalance is increased with augmentation and the case where the gap between two classes is closed using augmentation.
Color Space Variation
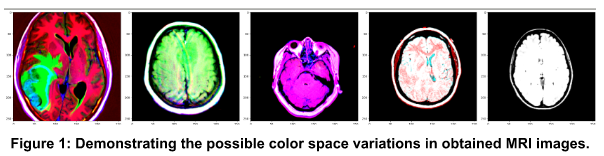
MRI images have different shapes, patterns, and colors (figure 1). This can make it difficult for the model to find the patterns.
Phase Variation
Collected images are in different stages of cancer for each individual. And each patient can have a unique tumor size and shape in each phase. Also, cancerous cells can originate in different areas of the brain and their progression in the brain can be drastically different for each patient.
There are a variety of different geometric shapes that represent particular Glioma types. An ideal network would be able to segment the majority of the affected area given all different factors that can affect the size and the shape of tumors.
Bias with respect to Tumor Size
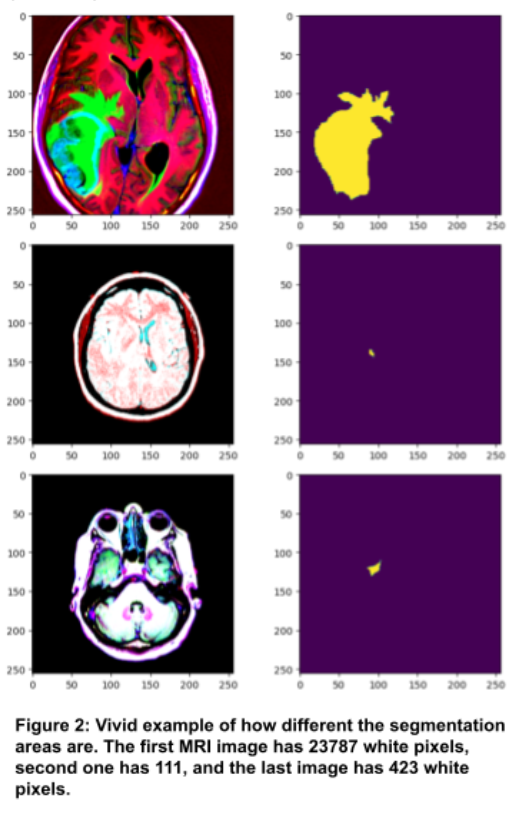
In order to objectively analyze different progression levels we can group samples based on their affected area which would be the number of pixels to be segmented. The number of pixels to be segmented can be a factor in the accuracy of the model as well. While evaluating different preprocessing pipelines, this variable has been taken into account, and accuracy is compared across different categories based on how large the segmentation area is. There is an obvious imbalance with respect to the number of pixels with the samples. The combined number of positive samples having less than 3200 pixels of interest is 491 whereas positive samples with more than equal to 3200 pixels of interest are 882. This can bias the model where MRI images with small tumors are not segmented correctly for being less frequent than ones with big tumors.
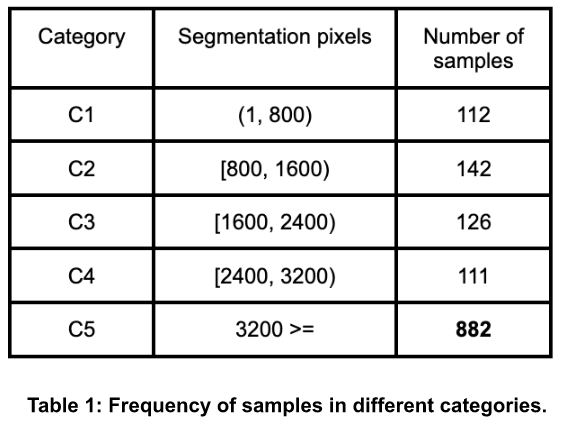
In order to train a robust model, the training data should have sufficient diversity with respect to tumor progressions and shapes. Meaning that different tumor sizes within the training data will make the model more robust. In this paper, the correlation between area of segmentation, and model accuracy is investigated to illustrate possible biases. The idea is that since there are more images in category C5, the model will do better at recognizing large tumors, ignoring smaller ones.
Training
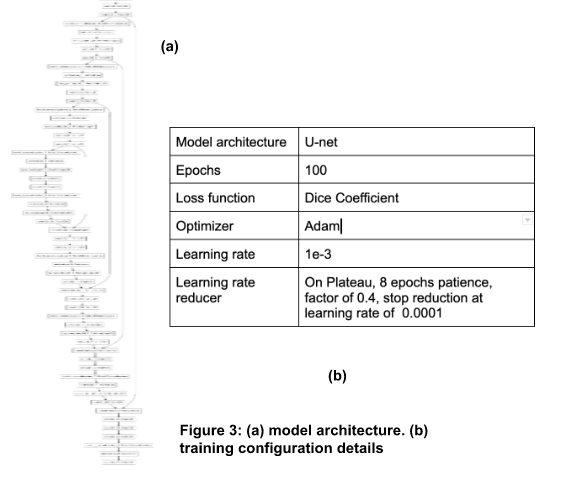
Same model configuration is used for all the experiments [1] since the main focus of this paper is on preprocessing techniques. The model architecture is u-net like architecture (figure 3(a)). Details of the model training and configuration are summarized in figure 3(b). Different transformation functions are used on the original dataset to generate different dataset. As an experiment, some training sets are designed to be imbalanced with respect to the number of positive and negative samples. It is important to note that by being balanced, I mean that the number is an acceptable difference between the number of positive and negative samples (if the difference between two different classes is less than 100 then it is considered balanced).
The goal of the experiments is to investigate if the accuracy increases with enhanced preprocessing or not.
Metrics
Dice coefficient and Intersection over union (IOU) are the main metrics used for evaluation but binary accuracy is also recorded during training. Dice coefficient gauges the similarity of two images:
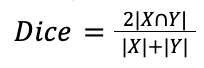
where X and Y represent pixels of images. IOU measures the correct segmentation area and gives a relative estimate with respect to segmentation on two sides.
Transformations
In order to keep the project minimal, only two transformations are used: Log transformation and power law (figure 4). Log transformation maps a narrow range of low intensity values in the input to a wider range of values and power-law is used to increase contrast within the image.
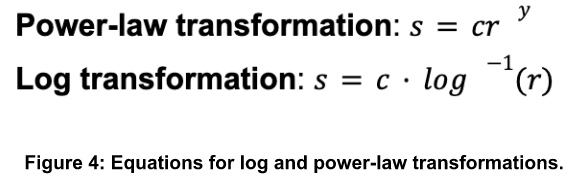
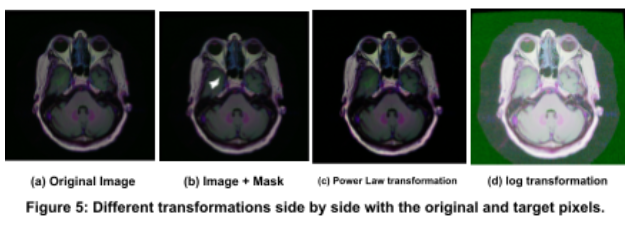
Figure 5 shows the result of log and power-law on an image. Applying power-law transformation (figure 5(c)) has increased the contrast around the target area, making the green value more visible within the picture. This slight change can increase model accuracy since higher contrast between adjacent pixels can enhance the segmentation accuracy. The log transformation (figure 5(d)) has changed the color spacing where the target area has a lighter value compared to its adjacent matrix. Again the contrast is emphasized in log transformation.
Evaluation
There are two aspects to evaluate for this segmentation task. Firstly, it is important to have a low number of false positives: meaning that it is important to avoid predicting cancer for healthy patients. The second criteria is for the model to segment a large portion of area correctly. In other words, the shape and size of the tumor should be detected accurately. IOU and dice metrics are sufficient for these purposes. However, the data used to evaluate is sampled to avoid imbalance both in class numbers and segmentation area. Hence, two different datasets are created to address validation goals:
-
Validating if the transformation and balancing the class labels is actually effective by comparing the accuracy of different training sets on the same model configuration.
-
Validating if there exists a bias with respect to the segmentation area, causing the model to not detect smaller tumors.
Being able to detect small tumors is really important for early detecting, and that is why the second evaluation is being done. In order to investigate the correlation between segmentation area and accuracy, a validation data consisting of an equal number of categories is created. First, 100 samples from each category are chosen. Then three different transformations are applied on each image, generating three images. At last the original samples and generated ones are put together. 75% of this validation data has not been used to train any of the models. It is important to note that this validation data only has positive examples and when evaluating the only objective is to determine if images with larger segmentation areas are easier to segment.
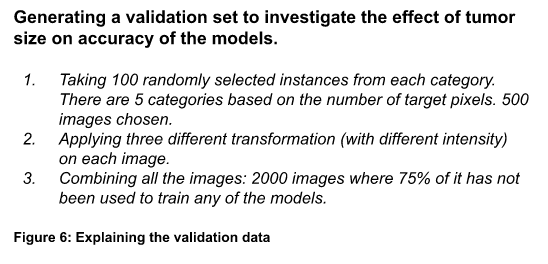
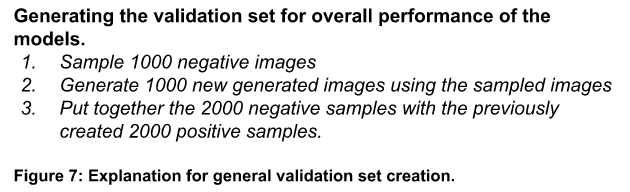
A separate validation data is used for the overall performance of the models. This validation data is created by sampling 1000 negative images generated using transformations, and putting the previous the dataset together. Resulting in 4000 images with 50% positive and negative samples (balanced classes). Also, there are an equal number of images from different categories (see figure 7).
Results
Before analyzing the results it is important to formally state the hypothesis that is stated:
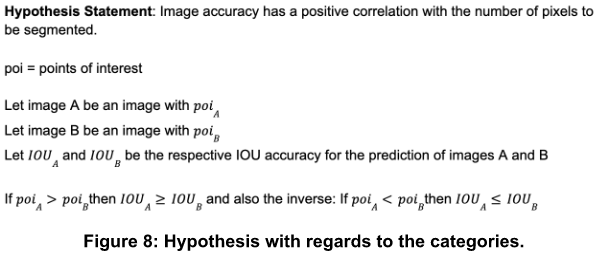
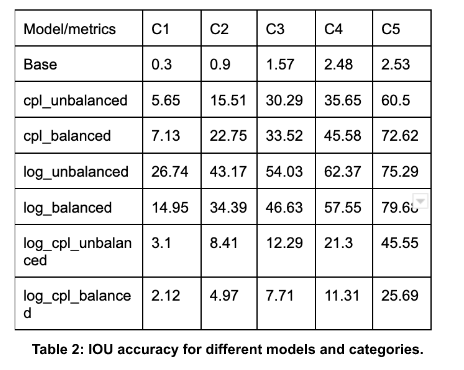
Table 2 shows the IOU metric for different models and categories. In all models, IOU increases as the pixels of interest increase. This confirms the hypothesis that the larger the area of the segmentation for images in a batch, the easier for the model to segment it. By observing table 2, it can be seen that for all the models:
C1 < C2 < C3 < C4 < C5
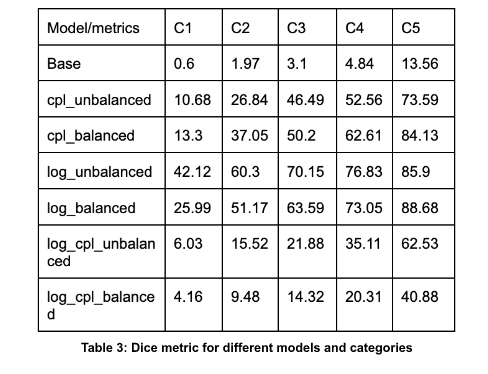
The numbers for two different metrics are different but the accuracy pattern is the same in table 2 and table 3.
The most accurate model for IOU and dice (table 3) metrics is the log_balanced model. In this model the log transformation is used and the number of classes is equal. It is vital to point out that the base model which used the raw data (without any augmentation) has the lowest accuracy among other models that were trained on augmented data. This supports the idea that data augmentation increases accuracy. Seventy five percent of the validation data is not used for training by any of the models yet models trained with augmented data are far more robust than the base model in segmenting these images.
Conclusion
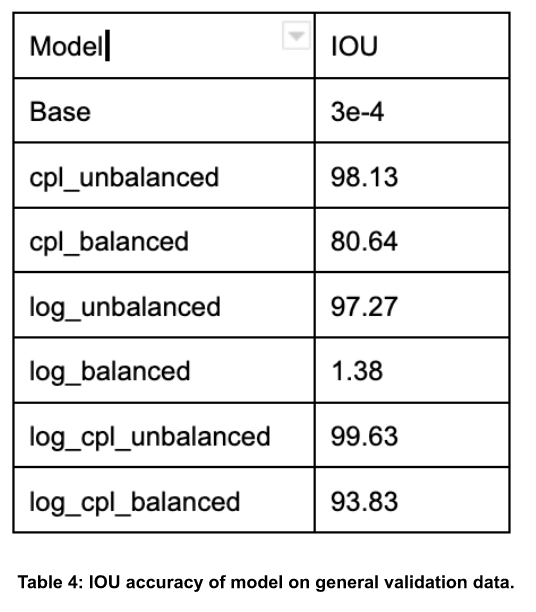
Running experiments using the same models with different training sets has shown that using different variations of data can increase accuracy. It also makes the model more robust to new data. Table 4 shows the IOU measure for the general validation data. Base model’s accuracy is really low compared to the other models. The most accurate model is when log and power law are used together. This is mainly because this training set is larger than other ones. Also log transformation seems to result in higher accuracies within the data. Also by running experiments on curated training sets, it was shown that samples with different tumor sizes should have close frequencies within the training data to avoid bias towards images with respect to their segmentation area.
Discussion
There are various other techniques that can be used to transform images but for MRI images it is important to sharpen the features. Options like generative models [5] such as DGCAN are not helpful. The procedure used in this paper can be repeated on larger models with different configurations. Also, the augmentation can be done in a larger scale to increase the size of the data to five fold or tenfold the original training size.
I believe analyzing the models based on different characteristics of the data provides insight on possible shortcomings of the model. By investigating these characteristics, and enhancing preprocessing, smaller models trained on small dataset can have comparable accuracies to large models trained on big data.
Another novel approach would be to use a mathematical method to increase the number of samples based on their characteristics. This idea is somewhat similar to sampling techniques used in various decision tree models, and can help penalize images with smaller segmentation areas. Say if the number of pixels that are expected to be segmented is less than 100 then augment these samples 3 times more just to make sure that the model will be penalized multiple times if the intended pixels are not segmented.
I think another important step would be to compare a large size model trained on big data with a smaller size model trained on smaller size data, and see if the methods discussed in this paper can actually result in a model that can replace bigger ones.
An interesting topic of discussion would be to do a cost-benefit analysis to determine if the cost of data augmentation is worth the amount of increase in performance. Since if data size is increased then more storage and computing resources will be needed, and in some cases the increase in performance will not justify the large scale investment in extra resources. For radio imaging, it is worthwhile to increase the accuracy given that early detection can increase cancer survival rates. The cost-benefit analysis is out of scope of this project but should be considered in real-world applications.
References
- Teja Surya, Kaggle, 2022 https://www.kaggle.com/code/tejasurya/unet-guide-segmentation-tumour-detector/notebook
- Mateusz buda, Kaggle, https://www.kaggle.com/datasets/mateuszbuda/lgg-mri-segmentation
- Shorten, C., Khoshgoftaar, T.M. A survey on Image Data Augmentation for Deep Learning. J Big Data 6, 60 (2019). https://doi.org/10.1186/s40537-019-0197-0
- Buda, M., Saha, A., Mazurowski, M.A., Association of genomic subtypes of lower-grade gliomas with shape features automatically extracted by a deep learning algorithm. Computers in Biology and Medicine, 109, (2019). https://doi.org/10.48550/arXiv.1906.03720
- Creswell, A., White, Tom., Dumoulin, V., Arulkumaran, K., Sengupta, B., Anil, B., Generative Adversarial Networks: An Overview https://doi.org/10.48550/arXiv.1710.07035
- Krizhevsky, A., Sutskever, I. & Hinton, G. E. (2012). ImageNet Classification with Deep Convolutional Neural Networks. In F. Pereira, C. J. C. Burges, L. Bottou & K. Q. Weinberger (ed.), Advances in Neural Information Processing Systems 25 (pp. 1097–1105) . Curran Associates, Inc. .
- Mazurowski MA, Clark K, Czarnek NM, Shamsesfandabadi P, Peters KB, Saha A. Radiogenomics of lower-grade glioma: algorithmically-assessed tumor shape is associated with tumor genomic subtypes and patient outcomes in a multi-institutional study with The Cancer Genome Atlas data. J Neurooncol. 2017 May;133(1):27-35. doi: 10.1007/s11060-017-2420-1. Epub 2017 May 3. PMID: 28470431.